
Hammer Candlestick: What it is and how to use it?

 Prefer us on Google
Navigating the cryptocurrency market can be challenging, but technical analysis tools like candlestick charts can help traders spot patterns and refine their strategies. These charts are useful not just in crypto, but also in stocks, forex, and other markets.
One key pattern to recognize is the hammer candlestick. This guide explains what it looks like and its significance in trading.
What is the Hammer Candlestick Pattern?
The hammer candlestick pattern is a popular bullish reversal signal used across various financial markets. Traders favor it because it suggests a potential upward trend reversal. For better accuracy, it's often combined with other technical indicators to confirm the trend change.
What does the Hammer Pattern Look Like?
The hammer pattern is easily recognizable on candlestick charts. It consists of a single candle with:
- A small real body (either bullish or bearish)
- A long lower wick (at least twice the body's length)
The pattern's reliability increases with the wick length – the longer the lower shadow, the stronger the potential bullish reversal signal.
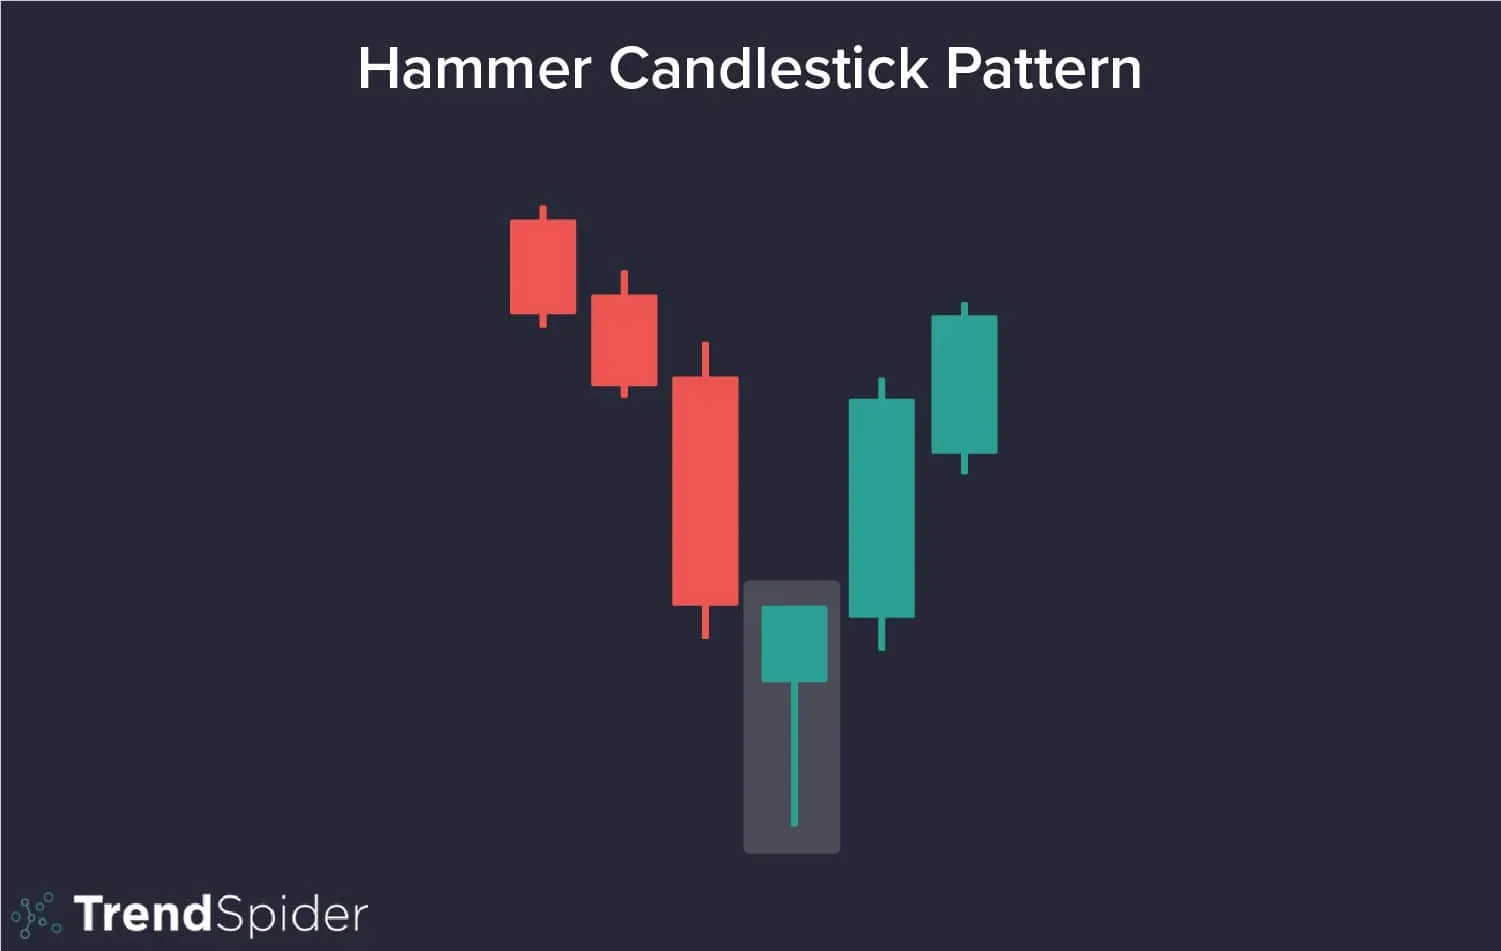
Source: TrendSpider
How to Trade with the Hammer Pattern?
When you identify a hammer pattern, follow these key steps:
- Confirm the signal - Never trade based solely on the hammer. Always validate it with:
- Additional technical indicators (e.g., RSI, moving averages)
- Support/resistance levels
- Volume analysis (increasing volume strengthens the signal)
- Consider market context - Check if the hammer forms:
- After a clear downtrend (for reversal validity)
- Near significant support levels
- Fundamental alignment - Verify if any news/events support the potential reversal
- Risk management - Place stops below the hammer's low and take profits at logical resistance levels
Remember: The hammer suggests potential bullish reversal, but always requires confirmation for higher-probability trades.
-- Price
Why Remember the Hammer Candlestick Pattern?
While the hammer pattern serves as a reliable bullish reversal indicator across financial markets, traders must acknowledge its inherent limitations. The pattern's primary weakness lies in its susceptibility to false signals, as external market forces can invalidate the anticipated trend reversal despite the hammer's formation. Nevertheless, its distinct visual characteristics make it one of the most recognizable and frequently occurring patterns in technical analysis.
However, the hammer candlesticks are easy to spot, and show up relatively often. The only thing to remember is to wait to act on it, as you should always confirm the trend via other indicators. This is the risk that comes with trading cryptocurrencies. Their volatility makes it difficult to navigate the market, and participants must always be vigilant and cautious.
This content is provided for general informational purposes only and doesn't constitute financial, investment, legal, or tax advice. Any events, rewards, online promotions, or related information mentioned herein should not be considered a recommendation, solicitation, or invitation to purchase, sell, trade, or otherwise deal in any crypto assets. Crypto assets are highly volatile and may result in loss. The availability of WEEX services, products, and related events may vary by region. You are responsible for ensuring that your participation is in accordance with applicable local laws and regulations.
You may also like
4 (FOUR) Token Price Prediction 2025-2030

What is Cryptocurrency Day Trading?

Dogecoin Price Prediction: What's Next for Dogecoin?
User Guide: What Are Perpetual Futures Contracts?
What Is a Bull Market?

3 White Soldiers Pattern: What it is and how to use it?
Bullish Candlestick Pattern

Bearish Candlestick Patterns

What Is MACD indicator?
What Is Relative Strength Index?

How to Read the Most Popular Candlestick Patterns?
How to Trade Futures on WEEX: A Complete Guide for Beginners
SOXSB Explained: Why the 3x Chip Bear ETF Resets Without You
CLARITY Act: What Happens in the Senate's September Window

How to Call a Crypto Exchange API Without Getting Blocked
Crypto Exchange API: Permissions, Signing and Rate Limits

QQQB and the Fed: What the FOMC Minutes Mean for Nasdaq-100
How to Trade Unitree Stock When You Can't Buy 688836

ETH to USDT: What the Converter Rate Leaves Out
Your Crypto Exchange Is Shutting Down: How to Move Your Funds and Choose the Next Exchange
Meta Stock at $548: The Free Cash Flow Number Behind the Drop
MU Stock Is Down 24% While Micron's Profits Hit Records

Kioxia Stock Before the Oct 1 Split: The 24/7 Perp Problem
Recordati Stock (REC): The Respighi BidCo Tender Offer, the Timetable and What Happens If You Do Nothing
Eiffage Stock (FGR): The Two Engines, the Motorway Concession End Dates and the 26 August 2026 Half-Year Results
Deutz Stock (DEZ): The 24 August 2026 Extraordinary General Meeting, the FFG Share Issue and What the Resolution Says
Logista Stock (LOG): The August 2026 Interim Dividend, the Four Dates That Decide Who Is Paid and What the Company Is
Netflix Stock Is Down 38%: What the Tape Is Pricing
BlackBerry Stock Up 125%: Why BB and BBX Are Not the Same
Nasdaq Futures vs Stocks: NQ at 30,141 and 3 Ways to Trade





